Interpretation of Public Reporting Scoring
Metric Scoring
All metrics are scored using statistical models developed from the most recent calendar year data. Quality performance is represented as a percentage ranging between 0 and 100% (called a “P score”) and can be thought of as the percentage of time the metric guideline is followed. For each hospital two P scores are displayed.
- Hospital P Score:
- Each hospital receives its own quality performance (P) score.
- This score can be used to assess individual hospital performance.
- A higher Hospital P Score means better individual hospital quality performance.
- State P Score:
- Each US state receives a quality performance (P) score.
- This score can be used to assess performance of all the ACC hospitals within a state.
- All hospitals within the same state will receive the same State P Score.
- A higher State P Score means better quality performance for all hospitals across the state.
Star Ratings
To more easily interpret the quality performance score, hospitals and states are grouped into four (4) star categories. These star categories are set based on the recommended performance (P score) that all hospitals should achieve in their care of patients. Star cutoff values are the same for all metrics.
Example: A hospital receiving a P score of 79.00% will receive a 2 star rating as its score falls in the 2 star range of 75%.00 – 84.99%.
Interval Estimate
The P score for a metric is based on the data available and therefore the scoring model accuracy depends on the amount of data for a hospital/state. There will always be some degree of uncertainty in the single P score given. The uncertainty in the P score is highest when a hospital/state has few data points and increases as more data becomes available.

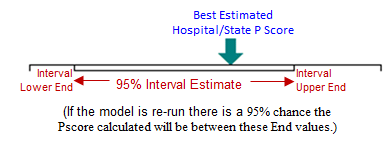
The degree of belief that can be placed in an individual P score can be shown using a figure called an ‘interval estimate’. The interval is displayed as a box drawn between a Lower End value and an Upper End value. If the model were to be re-run, there is a 95% chance the P score calculated would fall in the interval between the two End values.
A smaller confidence interval box, or distance between the Lower End and Upper End values, indicates a greater confidence in the single P score given to the hospital/state. The best estimate of the true value is the P score assigned and shown with the green arrow.
Minimum Data
To partially account for uncertainty when less data is available, a minimum number of cases has been established in order for the model to assign a P score. By requiring a minimum amount of data we ensure a reasonable degree of confidence that any score given is truly representative of the quality of performance at that site.
The minimum number of cases per year to receive a P score for CathPCI is: 25 cases for ICD is: 11 cases.

